The KPIs are calculated typically on a weekly basis. The trending results are published in form of
an automatic report (sent to the user in a PDF format) or
digitally over an API for visualization with 3rd party systems or
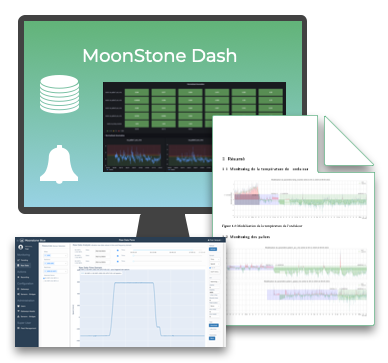
with GradeSens MoonStone Dash .
MoonStone Dash is our turnkey cloud solution able to visualize the KPI trends for each system and site. the dashboard is designed with a standard set of visualisation so that it can be deployed automatically for each production site.